Historical playback
Revisit a production shift through item journeys and station history. The native demo already offers scripted replay; real recorded production playback remains a future integration.
WAYLINE / INDUSTRIAL FLOW INTELLIGENCE
A factory is a journey through time.
Make every part of it visible.
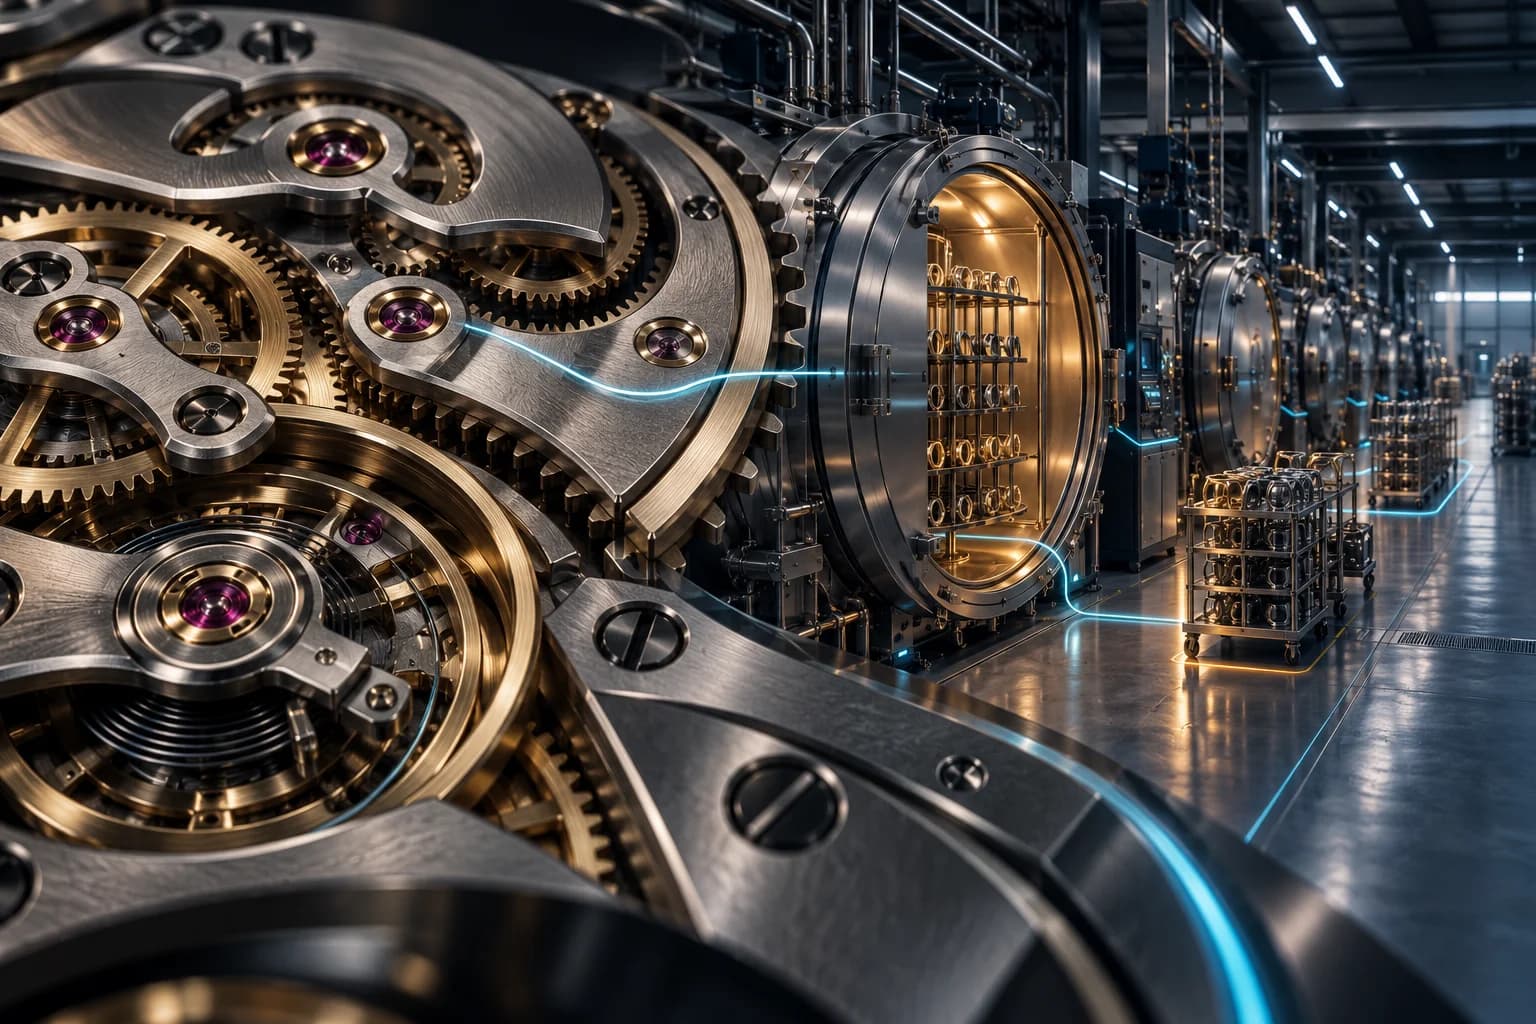
A watch turns in exquisite coordination. A factory aspires to the same rhythm, with people, maintenance, late materials and changing process times in the middle.
WAYLINE begins with the interruption. Follow the item, and the rhythm becomes visible.
The gears have no breaks.
People do.
Machines need maintenance. Material arrives late. Processing times vary. One interruption can change the pace of everything downstream.
Precision is the aspiration.
Visibility helps you understand the reality.
Where is it? What has it completed? How long did it work, and how long did it wait? One identity connects every stage of the journey.
WHERE THE IDEA ALREADY LIVES
A trolley.
A timestamp.
A traceable journey.
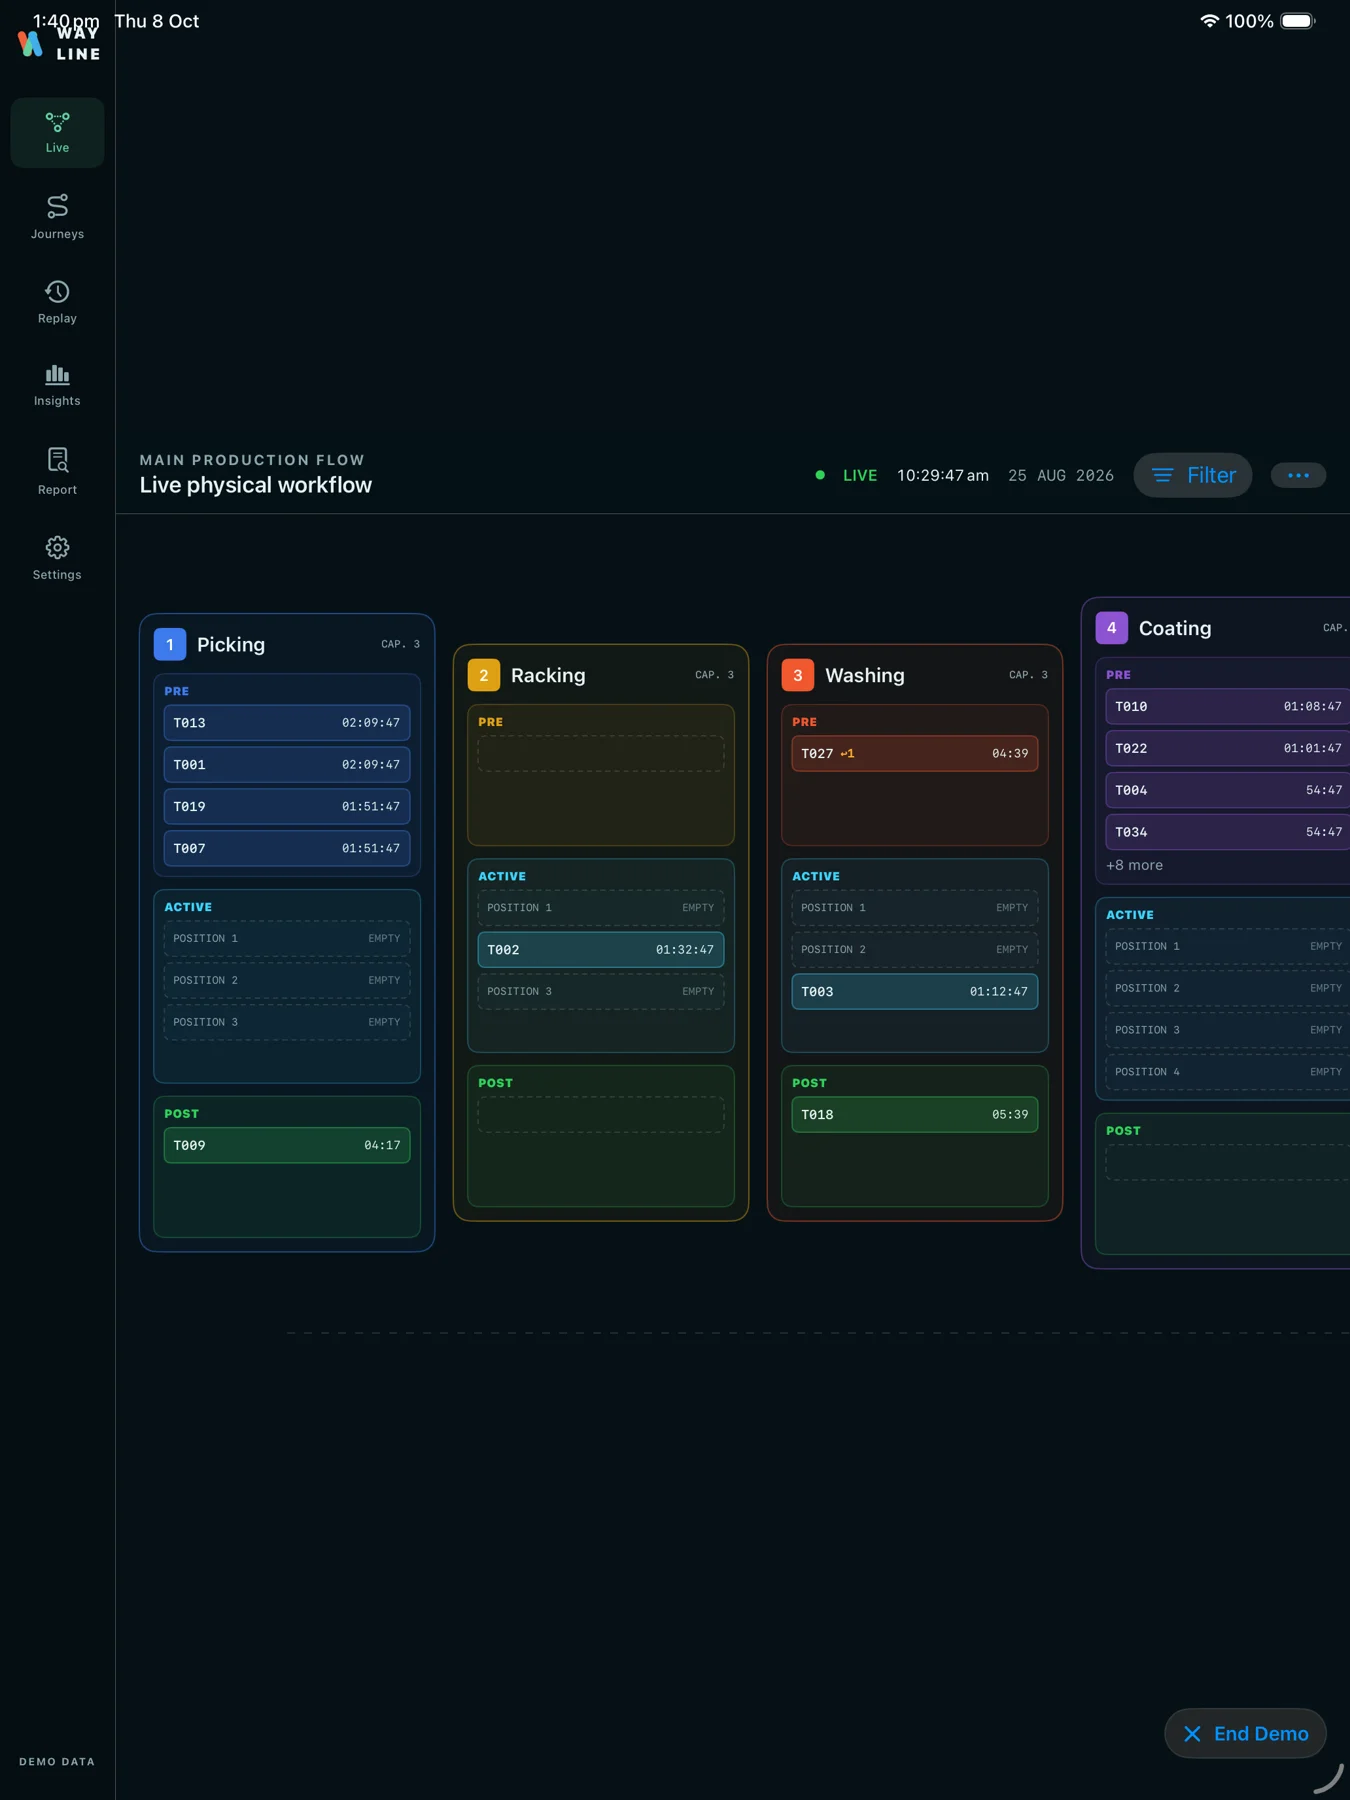
The native prototype follows numbered trolleys through six stages: Picking, Racking, Washing, Coating, De-racking and Finishing. Each stage separates PRE, ACTIVE and POST.
Journeys, returns, replay and authored insights already express the idea. The eight-stage browser line below develops that thinking into a new conceptual model.
Authentic interface / deterministic local scenario / no live factory connection
A machine can be busy while an item is still. Active time and waiting time need different measurements, different signals and the same clear timeline.
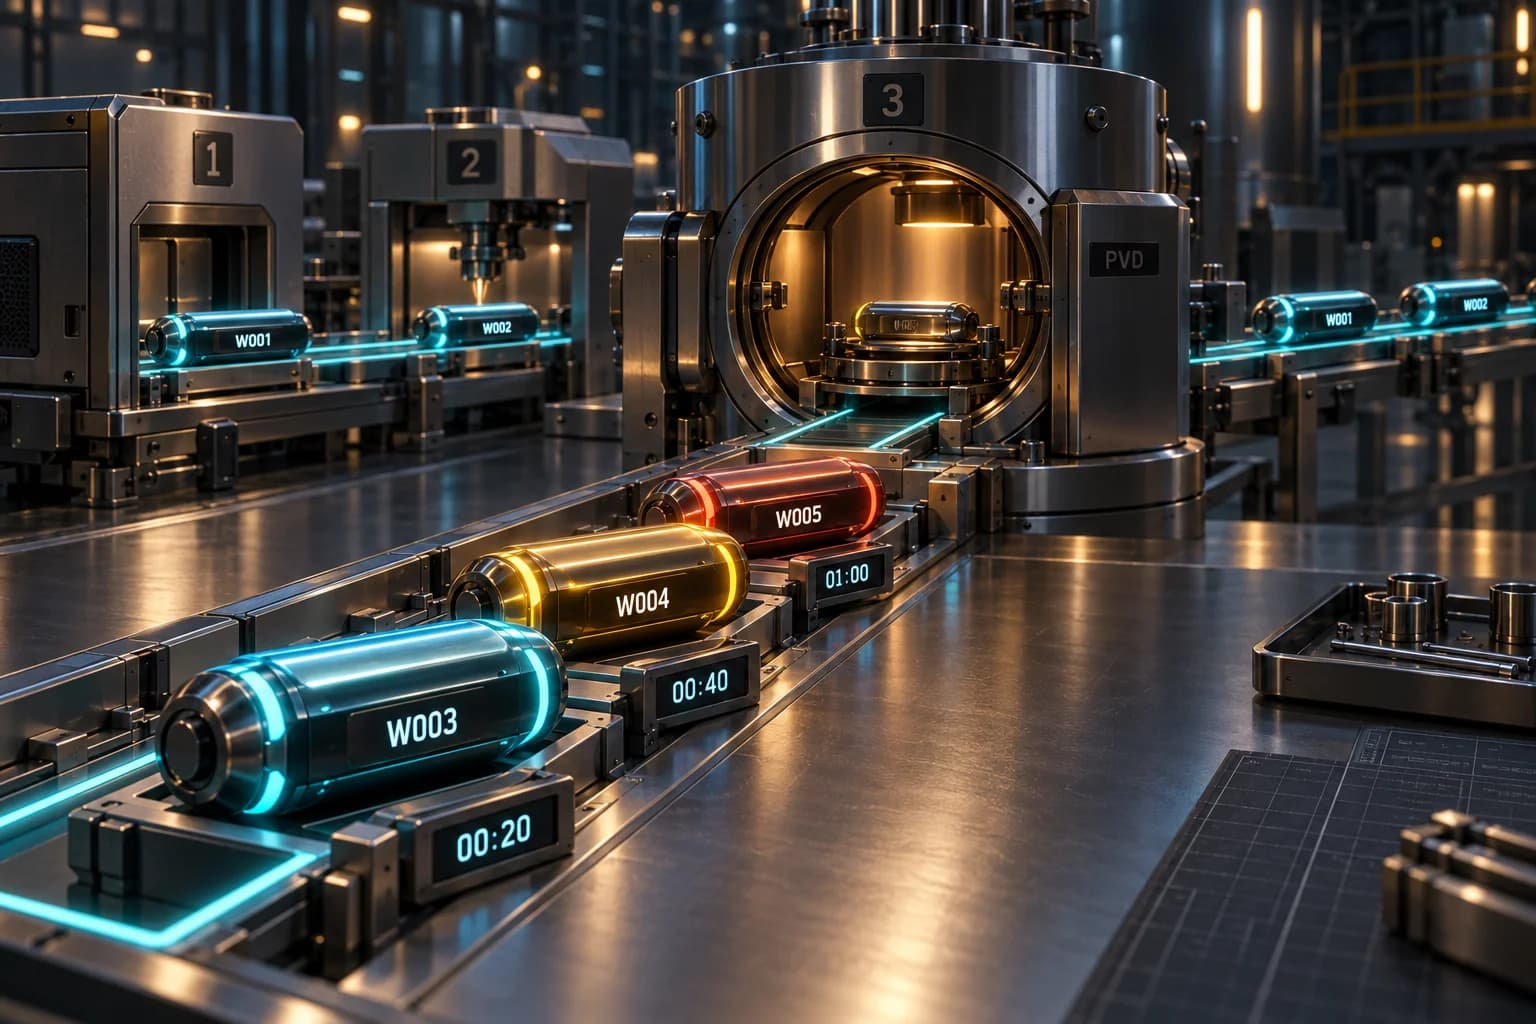
The item occupies a station slot. Its processing timer measures time spent in that operation.
The item is queued or dwelling in a waiting buffer. Its clock continues even when processing stops.
These are the simulation’s initial settings. Change the thresholds inside the factory. Colour always travels with readable status text.

Original imagegen concept icons / titanium, cyan and amber signal language
Flow efficiency = active processing time ÷ total journey time × 100A simple partition, calculated from the item’s history. In this model, journey time equals active processing plus waiting; transfers are instantaneous. It measures simulated flow, not the value of the work or an improvement claim.
Slow one stage. Watch the queue form. Restore the rhythm and see the backlog clear through real processing, one item at a time.
Start the flow, then slow the selected process. PVD coating is selected initially. Accelerate time to see the queue develop. Restore flow and follow the items through to completion.
Concept simulation · 24 items · illustrative seconds, not industrial cycle estimates
Ready. Start the flow or advance one step.
Simulated data · Throughput = completions ÷ elapsed hours. Efficiency = total active time ÷ total journey time for all arrived items, including work in progress.
Capsules retain their identity as they move between stages. Select one to follow its journey. On smaller screens, swipe across the overview.
W001 · Not yet arrived · pending
Arrival 00:00 · 0.0% flow efficiency
This item arrives at 00:00. Start or step the shift to follow its journey.
Operational · normal service
Capacity 0 / 4 occupied · 4 available
Expected service 36s · base 36s
Changes apply to new admissions. Work already in progress retains its scheduled finish. Buffers wait for their configured dwell, then join the next stage’s queue.
Waiting signals use these scenario thresholds, in simulated seconds. They are illustrative settings, not universal definitions of acceptable factory delay.
Finite arrivals every 12 seconds. Six processes and two buffers. FIFO queues, independent admission slots, no batch physics, transfers treated as instantaneous. This illustrates flow logic; it does not model a real PVD recipe, safety interlocks or production hardware. The clock pauses while the browser tab is hidden.
The item reveals the journey. The station reveals the constraint. The manager sees how they connect.
Item.
Station.
Whole factory.
Move from one capsule’s history to a station’s workload, then to the operation’s entire journey map. The standalone browser dashboard uses the same simulation model and gives the factory more room.
Open the manager dashboard ↗A queue is a signal to investigate. It does not establish why a station slowed or prescribe what people should do.
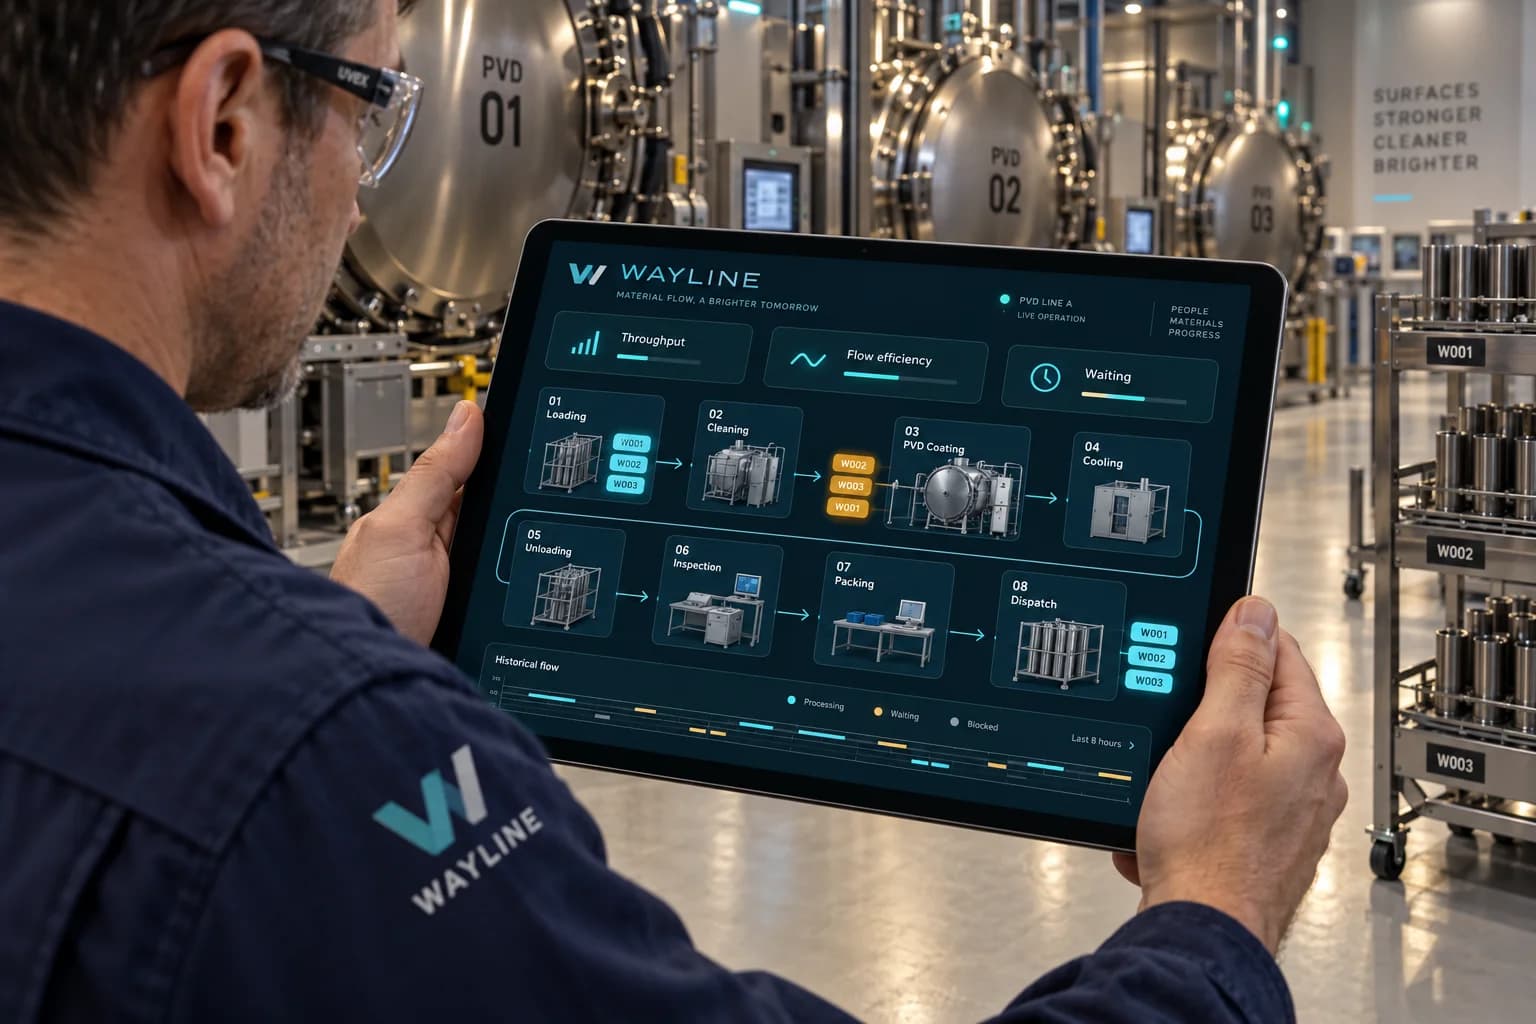
The generated tablet is a future interface study. The working browser dashboard shows computed simulated data. Neither connects to production equipment, telemetry or real operational records.
The prototype is a starting point. The vision reaches toward playback, scenario planning and earlier understanding of developing constraints.
FUTURE CONCEPTS / NOT DEPLOYED PRODUCT PROMISES
Revisit a production shift through item journeys and station history. The native demo already offers scripted replay; real recorded production playback remains a future integration.
Explore whether developing queues could reveal tomorrow’s constraints earlier. A vision for investigation, not a deployed prediction engine.
Ask what a different admission capacity or service time might change. The browser model provides an illustrative first experiment.
Compare the assumptions and outcomes of alternative workflows, with clear conditions rather than a promised productivity gain.
Surface patterns in process history while keeping association distinct from causation. Current native insights are authored examples.
Imagine an operational overview spanning several connected lines. The current browser simulation models one finite illustrative line.
WAYLINE / SPECIMEN 007
An evolving product, a working prototype and a carefully labelled vision of what comes next.
Explore the flow again ↗Return to the specimen archive →